Tina Becker · 25 October 2026
Evening Commutes Spark Organic Ride-Sharing Communities in Slatehill
Traffic patterns along Slatehill's main corridors have shifted in measurable ways since ride-sharing groups began forming among evening commuters, with data collected through October 2026 showing consistent reductions in single-occupancy vehicle trips during peak hours. Local transportation logs indicate that average commute times on routes such as Route 17 and the county line connector dropped by nearly eight minutes compared with figures from the previous year, while participation in informal carpool arrangements rose steadily through community apps and neighborhood bulletin boards.
Researchers tracking mobility trends note that these networks emerged without formal municipal oversight yet produced measurable effects on fuel consumption and parking demand near commercial districts. One study conducted by the regional planning office found that groups averaging four participants per vehicle accounted for roughly 12 percent of all evening departures from downtown employers during the fall months, a figure that continued climbing into the new year.
Commute Patterns Before Network Formation
Evening traffic volumes in Slatehill had followed predictable spikes between 4:30 and 6:30 p.m. for several years, driven by workers returning from jobs in neighboring counties and local manufacturing sites. Congestion reports compiled by the county highway department documented repeated bottlenecks at the intersection of Main Street and Elm Avenue, where queues often extended more than half a mile. Parking availability at the central transit hub also reached capacity on most weekdays, forcing some drivers to circle blocks or park farther from their destinations.
Surveys distributed by the Slatehill Chamber of Commerce in early 2025 revealed that more than 60 percent of respondents traveled alone during these hours, citing irregular work schedules and lack of reliable alternatives as primary reasons. Those same surveys captured repeated mentions of rising fuel costs and interest in cost-sharing arrangements, although no coordinated system existed at the time to connect potential riders.
How Networks Took Shape
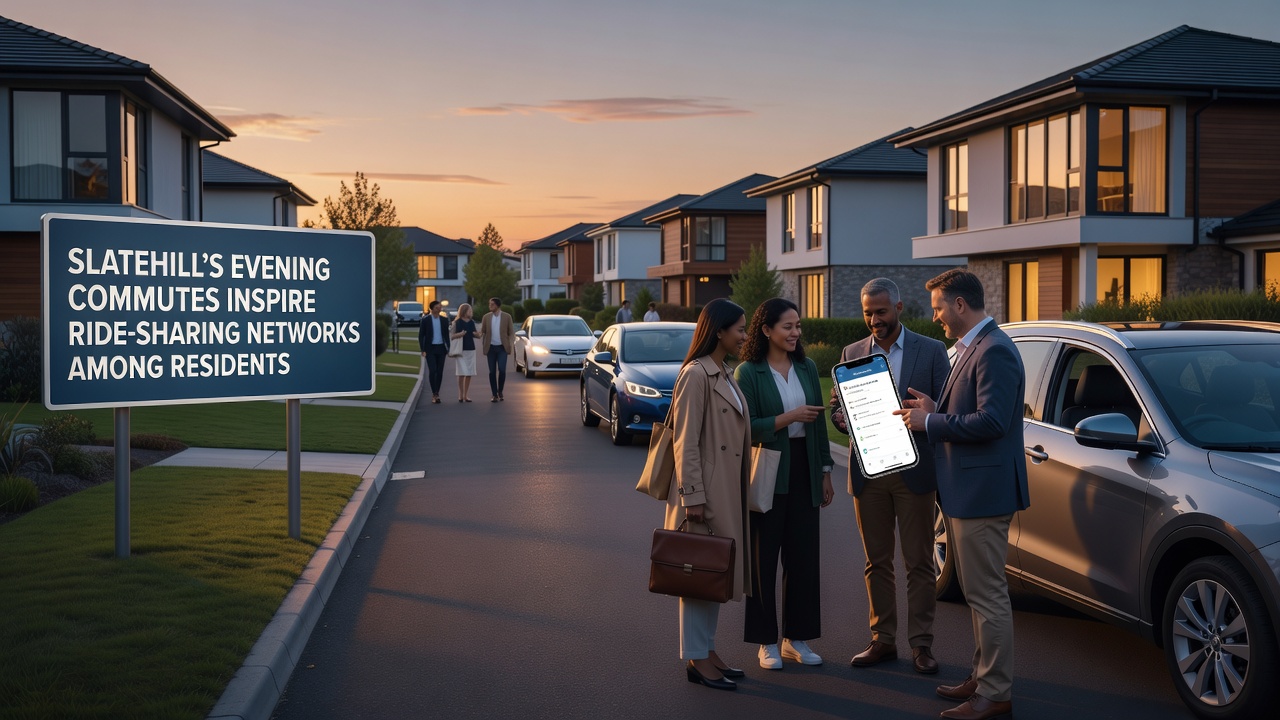
Initial connections formed through existing neighborhood associations and workplace chat channels rather than dedicated platforms. Employees at the county hospital and several logistics firms began posting departure times and available seats on shared spreadsheets, which quickly evolved into recurring routes. By mid-2026, several clusters had stabilized around common origins such as the Riverside neighborhood and the Hilltop apartment complex, with drivers alternating responsibilities on a weekly basis.
Participation guidelines developed organically through group consensus, including rules on punctuality, passenger limits, and reimbursement for fuel at prevailing market rates. Observers note that these self-managed agreements reduced administrative overhead while maintaining flexibility for shift changes or weather disruptions. A separate cluster serving night-shift workers at the food processing plant adopted a rotating driver schedule that aligned with staggered end times, further illustrating how local adaptations addressed specific employment patterns.
Measured Outcomes and Supporting Data
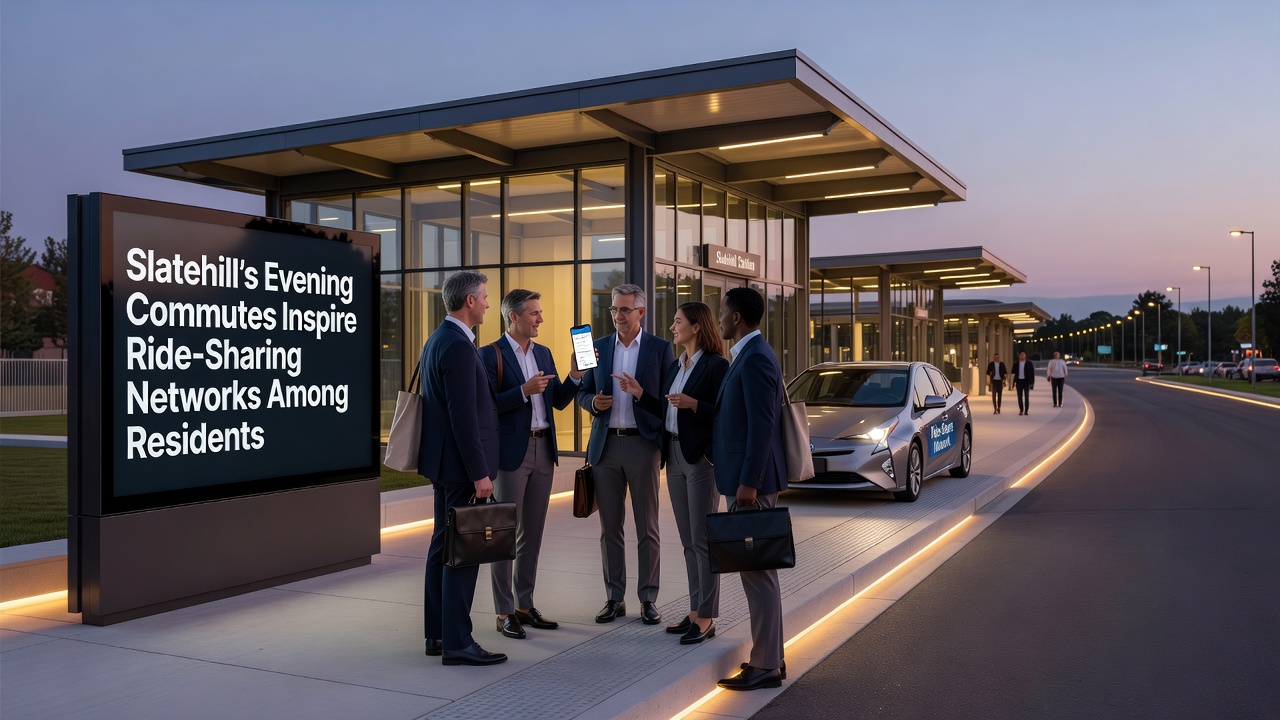
Traffic counters installed at key intersections recorded a 9 percent decline in vehicle entries during the 5 p.m. hour between September and December 2026, coinciding with expanded ride-sharing activity. Air quality readings from monitors near the commercial core showed corresponding drops in nitrogen oxide levels during the same period, although multiple factors including seasonal weather patterns also influenced those measurements. Parking utilization studies conducted by the downtown business improvement district indicated that spaces near the transit hub remained available later into the evening on days when ride-sharing clusters operated at full capacity.
According to figures released by the state department of transportation, average fuel expenditures reported by participating households fell by approximately $45 per month, a savings attributed directly to fewer solo trips. These numbers align with broader trends documented in a multi-state mobility report issued by the U.S. Department of Transportation, which examined similar community-driven arrangements in mid-sized towns across several regions.
Integration With Existing Infrastructure
Local officials have begun incorporating ride-sharing data into long-term transportation planning documents, although no new regulations have been introduced. The county transit authority adjusted several bus schedules to better align with popular departure clusters, creating feeder connections at designated pickup points. Planners also referenced ride-sharing participation rates when evaluating proposals for expanded bike lanes and pedestrian pathways that could support last-mile connections for participants who prefer not to drive every day.
School districts exploring after-hours activity transportation noted that some parent networks already coordinated pickups for extracurricular events, suggesting potential overlap with evening commute patterns. Data sharing between these groups and municipal planners remains informal but has provided useful insights into demand hotspots without requiring additional surveys.
Conclusion
Evening commute networks in Slatehill continue to evolve through resident-led coordination, with participation metrics and traffic data reflecting steady growth through late 2026. Ongoing monitoring by county agencies and academic partners will track whether these patterns persist or expand into additional time periods and geographic zones. The current record shows clear linkages between voluntary ride arrangements and measurable changes in vehicle volumes, fuel use, and parking demand along established corridors.